Motivations and Objectives
Novel sensing technologies enable aerial vehicles to continuously gather information related to their operating and structural states. Incipient damage can be detected, localized and quantified with proper implementation of onboard sensor networks and SHM algorithms.
On the other side, dynamic aeroelastic effects resulting from the interaction of the aerodynamic, elastic, and inertial forces require careful consideration throughout the design phase of the aircraft and pose a major safety-critical factor in the qualification of aircraft into service. Efforts towards developing system and model identification techniques for data-driven aeroelastic modeling, damage assessment and online parameter estimation have been previously made and tested. However, the treatment of constantly varying operating and structural states remains a significant challenge that needs to be addressed.
Method of Approach
- A range of high-fidelity finite element (FE) models has been developed, which contain an array of damage modes at predefined locations. The laminate configuration is parameterized via its structural properties, including laminate stacking sequence, ply orientation, ply thickness and corresponding material properties for each ply. The pre-defined damages are parameterized by their damage modes, locations and sizes. Each one of three damage modes is modeled by different patterns of mesh discontinuity and stiffness reduction. Also, a Bayesian model updating technique is applied to calibrate this numerical model with limited amount of experimental data. This process will create a pool of damage inputs-structure output data sets on a range of laminate configurations.
- The uncertainty modeling and quantification of the manufacturing variabilities and service-induced defects will be based on the proposed mesoscale and continuum (FE) models and implemented via Bayesian inversion accounting for potential statistical dependencies of material elasticity tensors along with a metamodeling technique utilizing stochastic spectral embedding (SSE). Prior information about the model parameters will be extracted based on preliminary experiments and prior expert knowledge (the research team has access to relevant experimental data that will be employed at the initial stage of the project).
- Leveraging system identification techniques, we are developing a data-driven stochastic time series modeling approach for the effective representation of wave/vibration dynamics under progressing damage conditions, environmental/operational conditions and laminate configuration. And develop a unified probabilistic SHM diagnostics framework for composite structures that makes optimal use of distributed and potentially noise-corrupted, ultrasound/vibrational signals and can: (i) detect fatigue damage precursors, (ii) identify the damage mode and (iii) follow damage evolution via integrated probabilistic localization and quantification (extraction of decision confidence intervals).
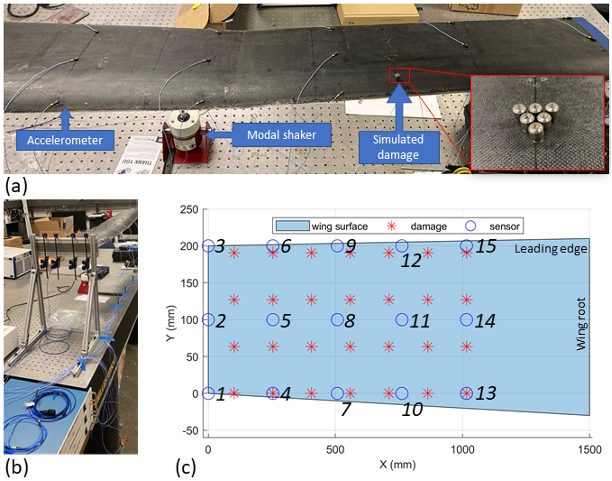
- For the experimental validation and assessment, a series of laboratory experiments are being performed on a protorype composite wing under various structural health states.
Current Work
- Modeling composite wing structure in with multi-fidelity FEM methods.
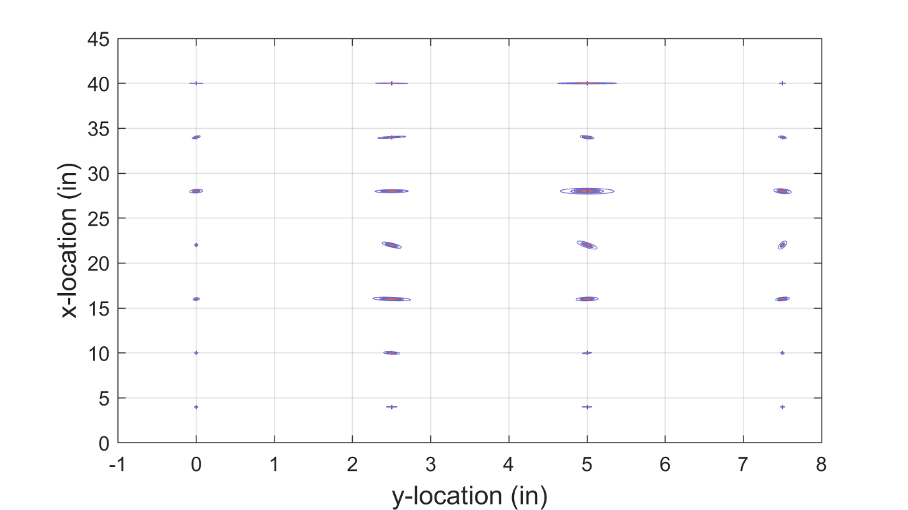
- Spectral analysis and parametric model identification for global damage identification on a composite wing structure.
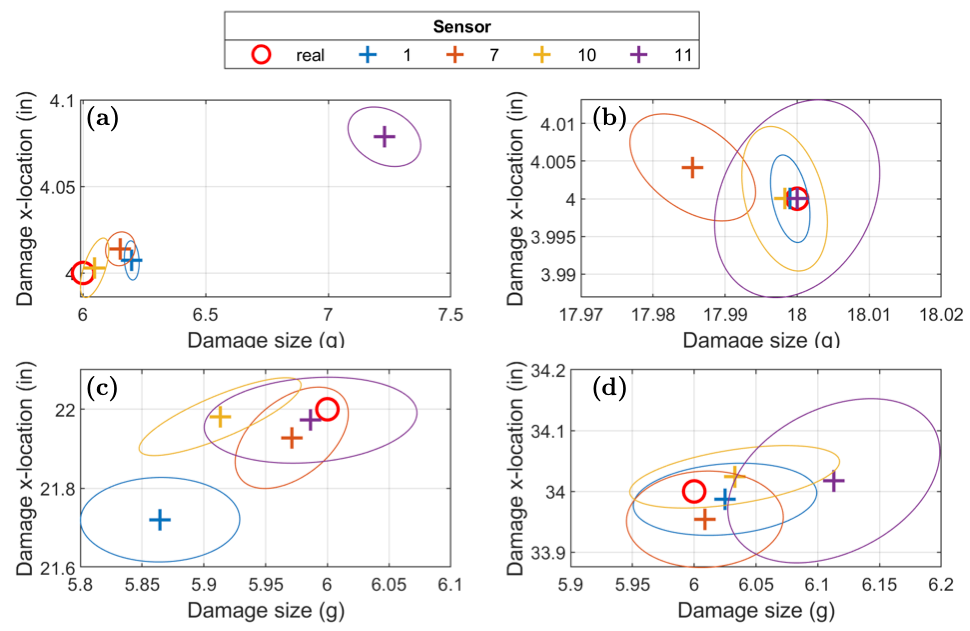
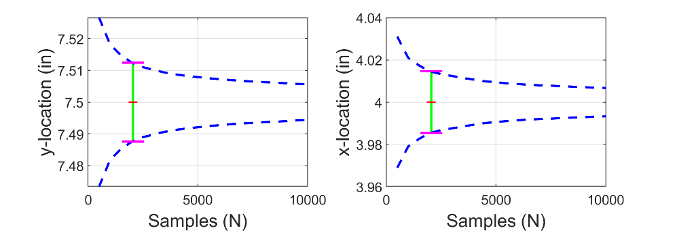
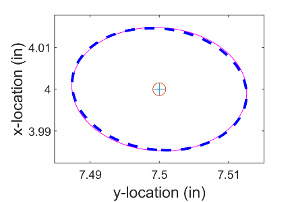
- Leveraging Cramer-Rao lower bound in order to assess the accuracy, robustness and overall effectiveness of the damage state estimation methodology.